Electrify Chicago
An independent tool for viewing City of Chicago building data
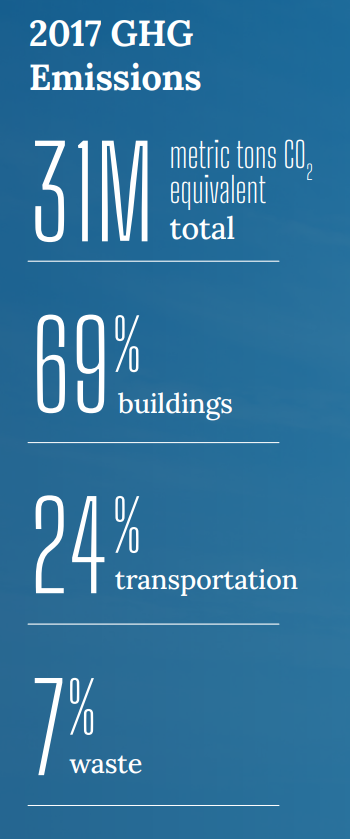
According to the
2022 Chicago Climate Action Plan ,
69% of Chicago's emissions come from buildings, making
building emissions our biggest challenge and our biggest opportunity as a city
to tackle climate change. At Electrify Chicago, we showcase building performance using
publicly available data supplemented by community-submitted photographs and building
owners.
,
69% of Chicago's emissions come from buildings, making
building emissions our biggest challenge and our biggest opportunity as a city
to tackle climate change. At Electrify Chicago, we showcase building performance using
publicly available data supplemented by community-submitted photographs and building
owners.
Start by looking at Chicago's buildings with the highest greenhouse gas intensity i.e. emissions per square foot. Large, efficient, buildings can perform much better than very inefficient small buildings on this metric.
New Article
📰 $30 Million In Missed Fines
The City Of Chicago failed to collect $30 million in potential fines from the building benchmarking ordinance, reducing transparency and accountability.
Legislative update! 🎉
As of late January 2024, legislation is being introduced to require new use more efficient forms of water and space heating, via the Clean And Affordable Buildings Ordinance (CABO), which will reduce the number of highly polluting and inefficient buildings that end up on this site.
If you're in Chicago,
write to your alderman to support the CABO!
Chicago Buildings by Greenhouse Gas Intensity
Note: Data includes large Chicago buildings with data from 2022, unless explicitly stated otherwise.
Note: This data only includes buildings whose emissions are reported
under the
Chicago Energy Benchmarking Ordinance. According to the City “As of 2016,
this list includes all commercial, institutional, and residential buildings larger than
50,000 square feet.” This dataset is also then filtered to only buildings with
reported emissions > 1,000 metric tons CO2 equivalent.
The latest year of data is from 2022, but we update the site regularly when new data is available, and some buildings may have failed to report that year, and only have older data available.
| Property Name / address | Primary Property Type |
Greenhouse Gas Intensity (kg CO2 eq./sqft) |
Total Greenhouse Emissions (metric tons CO2 eq.) |
|---|---|---|---|
|
5841 S. Maryland Ave MC0985
🚨
(UChicago)
5841 S. Maryland Ave MC0985
| Hospital (General Medical & Surgical) | 25.0 kg/sqft #27 Highest
| 135,876 tons #1 Highest
|
|
IN0035-21C Museum Hotel Chicago
🕰️
55 E Ontario St
| Hotel | 25.0 kg/sqft | 1,797 tons |
|
Jewel Osco, 03501-Western & Roscoe
🚩
3400 N Western Ave
| Supermarket/Grocery Store | 24.8 kg/sqft #29 Highest
| 1,378 tons
Highest 34%
|
|
Stroger Hospital Campus
🚨
1901 W Harrison St
| Hospital (General Medical & Surgical) | 24.8 kg/sqft #29 Highest
| 39,603 tons #7 Highest
|
|
Hotel Palomar Chicago
🚩
505 N State St
| Multifamily Housing | 24.7 kg/sqft #31 Highest
| 3,473 tons
Highest 11%
|
|
600 N MICHIGAN AVE
🚩
600 N MICHIGAN AVE
| Retail Store | 24.7 kg/sqft #31 Highest
| 5,180 tons
Highest 6%
|
|
70800570 -- Dan Ryan
🕰️
112 W 87th St
| Supermarket/Grocery Store | 24.7 kg/sqft | 1,524 tons |
|
03241-Paulina & Division
🚩
1341 N Paulina St
| Retail Store | 24.6 kg/sqft #32 Highest
| 1,292 tons
Highest 37%
|
|
Comer Children's Hospital
🕰️
5721 S Maryland Ave
| Hospital (General Medical & Surgical) | 24.4 kg/sqft | 9,611 tons |
|
Jackson Park Hospital
🕰️
7531 S Stony Island Ave
| Hospital (General Medical & Surgical) | 24.1 kg/sqft | 9,219 tons |
|
Ravenswood Station
🚩
1800 W LAWRENCE AVE
| Supermarket/Grocery Store | 24.1 kg/sqft #33 Highest
| 3,607 tons
Highest 10%
|
|
Saint Anthony Hospital - Main Hospital
🕰️
2875 W 19th St
| Hospital (General Medical & Surgical) | 24.0 kg/sqft | 5,735 tons |
|
53100527--CHICAGO
🕰️
2021 W Chicago Ave
| Supermarket/Grocery Store | 23.9 kg/sqft | 1,312 tons |
|
NMH Olson Pavilion
🚩
(Northwestern)
710 N Fairbanks Ct
| Laboratory | 23.9 kg/sqft #34 Highest
| 4,462 tons
Highest 8%
|
|
Jewel Osco, 03376-Kinzie & Des Plaines
🚩
370 N Desplaines St
| Supermarket/Grocery Store | 23.7 kg/sqft #36 Highest
| 1,538 tons
Highest 30%
|
Data Source:
Chicago Energy Benchmarking Data